ECG / EKG Interpretation - Introduction
ECG / EKG Interpretation - Part 1


Standard US shipping included (We ship internationally daily)
Product Description
Electrocardiogram (ECG or EKG) measures the electric pulses generated by a heart. The electric pulses control the timing, synchronization and pumping actions of a heart. It is a vital organ that controls the blood circulation within a body. To understand and interpret ECG, we need to start with the relationship between the electric pulses and the heart movements.
This article only covers the very basics in layman terms so you can ask questions and understand the answers when you visit your doctor. The correct interpretation of ECG is complex and requires extensive training. Your doctor is the best person to do this.
A heart has two pumps (left and right). The right pumps deoxygenated blood from the body to the lung for acquiring oxygen and the left pumps oxygenated blood from the lung to the rest of the body. Each pump has an upper chamber (atrium) and a lower chamber (ventricle). The atrium collects the blood and passes it on to the ventricle. It then pumps the blood out of the heart. The blood flow is controlled by a series of valves that make sure the blood flow occurs only in one direction.
The following diagram, obtained from Electrocardiogram, shows the animation of a heart in action. Note how the electric signals start from the top left, SA node (sinoatrial node), and travel to the center of the heart (AV node or atrioventricular) before propagating to the lower chambers. The first part is when the upper chambers collect and pass the blood to the lower chambers. The second part is when the lower chambers pump the blood out of the heart.
Under normal circumstances, the SA node is the natural pacemaker that controls and regulates the pulse rate. At the beginning of each cycle, it generates electric impulses to cause the atrium to pump blood. If impaired, its function can be taken over by other parts of the heart or an artificial pacemaker.
A 12-lead ECG generates 12 different views of the electrical activities. Each view puts a different emphasis on different parts of the heart and shows a different direction of the activities. See Electrocardiogram for more details.
Measurement units
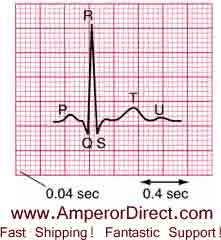
EKG is recorded on standard paper typically running at 25 mm/sec and is measuring millivolts versus time. Each big box is 5 mm square and corresponds to 200ms (horizontal) and 0.5mV (vertical). Each small square corresponds to 40ms and 0.1mV. It is common practice to use the distance on the graph instead of the actual unit; for example one may say 2mm or two blocks instead of 0.2mV.
Electrocardiogram (ECG or EKG) measures the electric pulses generated by a heart. The electric pulses control the timing, synchronization and pumping actions of a heart. It is a vital organ that controls the blood circulation within a body. To understand and interpret ECG, we need to start with the relationship between the electric pulses and the heart movements.
This article only covers the very basics in layman terms so you can ask questions and understand the answers when you visit your doctor. The correct interpretation of ECG is complex and requires extensive training. Your doctor is the best person to do this.
A heart has two pumps (left and right). The right pumps deoxygenated blood from the body to the lung for acquiring oxygen and the left pumps oxygenated blood from the lung to the rest of the body. Each pump has an upper chamber (atrium) and a lower chamber (ventricle). The atrium collects the blood and passes it on to the ventricle. It then pumps the blood out of the heart. The blood flow is controlled by a series of valves that make sure the blood flow occurs only in one direction.
The following diagram, obtained from Electrocardiogram, shows the animation of a heart in action. Note how the electric signals start from the top left, SA node (sinoatrial node), and travel to the center of the heart (AV node or atrioventricular) before propagating to the lower chambers. The first part is when the upper chambers collect and pass the blood to the lower chambers. The second part is when the lower chambers pump the blood out of the heart.
Under normal circumstances, the SA node is the natural pacemaker that controls and regulates the pulse rate. At the beginning of each cycle, it generates electric impulses to cause the atrium to pump blood. If impaired, its function can be taken over by other parts of the heart or an artificial pacemaker.
A 12-lead ECG generates 12 different views of the electrical activities. Each view puts a different emphasis on different parts of the heart and shows a different direction of the activities. See Electrocardiogram for more details.
Measurement units
EKG is recorded on standard paper typically running at 25 mm/sec and is measuring millivolts versus time. Each big box is 5 mm square and corresponds to 200ms (horizontal) and 0.5mV (vertical). Each small square corresponds to 40ms and 0.1mV. It is common practice to use the distance on the graph instead of the actual unit; for example one may say 2mm or two blocks instead of 0.2mV.
Shipping Information
Shipping Weight: 0.00 Pounds
Availability: In stock! Ready to ship.
Shipping Cost: US Shipping included! Int'l Shipping calculated at checkout
In-stock items are normally shipped within 24-48 hours on business days. For special handling or overnight shipping, please call us at 281-664-1209.
Manufacturer Information
Manufacturer:
Item Code:
Product belongs to these categories...
Home ECG / EKG Monitor
