ECG / EKG Components
ECG / EKG Interpretation: Part 2


Standard US shipping included (We ship internationally daily)
Product Description
Components of ECG
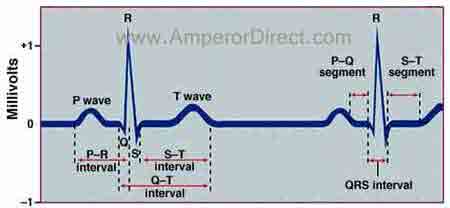
Each ECG cycles consists of 5 waves: P, Q, R, S, T corresponding to different phases of the heart activities. The P wave represents the normal atrium (upper heart chambers) depolarization; the QRS complex (one single heart beat) corresponds to the depolarization of the right and left ventricles (lower heart chambers); the T wave represents the re-polarization (or recovery) of the ventricles. To interpret ECG, one needs to focus on the frequency (heart rate), regularity, shape and size of each individual waves and the timing and interaction between waves. The following diagram shows the components of a ECG cycle.
P Wave
The P wave occurs when both left and right atria are full of blood and the SA node fires. The signal causes both atria to contract and pump blood to the ventricles (lower chambers). Any abnormality is generally associated with the SA node and the atria.
Lead II and V1 are the best leads to observe p-waves.
General characteristics :
- Less than 100ms in duration
- Less than 2.5mm in amplitude
Examples of abnormal P waves
| Abnormal Patterns | Possible Causes |
|---|---|
| Inverted |
|
| Greaten than 2.5mm in amplitude |
|
| Longer than 100ms with two lobes |
|
| Invisible or absent |
|
PQ Segment
When the signal from the SA node arrives the AV node, the signal is slowed and paused for a short period to allow blood from the atria to fill the ventricles.
General characteristics :
- 120 - 200ms in duration from the beginning of P wave to the beginning of QRS complex (PR interval)
Examples of abnormal PR interval
| Abnormal Patterns | Possible Causes |
|---|---|
| Greater than 200ms in duration |
|
| Less than 120ms in duration |
|
Q Wave
The Q wave is generated when the AV nodes releases the signal that travels through the inter-ventricular septum.
General characteristics :
- Less than 2mm or 3ms in duration
- Less than 25% of the corresponding R wave amplitude
- Normal Q wave in lead III may diminish or disappear on deep inhaling because of the change in the heart relative position; however the infarction related Q wave persists.
R Wave
R wave is the first positive deflection after the P wave regardless whether a Q wave exists or not. As the signal continues from the AV node and spreads to the ventricles, the signal triggers a contraction on the left ventricle that pumps blood out of the ventricle.
There may be multiple R waves.
S wave
S wave is generated when the basal parts of the ventricles are depolarized resulting in the contraction of the right ventricle.
QRS Complex
The Q, R and S waves together are referred to as QRS complex (even if some of its components are missing). It is the electrical forces generated by ventricular depolarization and represents the pumping action of the ventricles.
General characteristics :- 80 - 120ms in duration
| Abnormal Patterns | Possible Causes |
|---|---|
| Greater than 120ms in duration |
|
| Less than 120ms in duration |
|
ST Segment
The ST segment marks the time for the ventricles to pump the blood to the lung and body. In normal situations, it serves as the base line from which to measure the amplitudes of the other waveforms.
Examples of abnormal ST segment
| Abnormal Patterns | Possible Causes |
|---|---|
| Depressions |
|
| Elevations |
|
T Wave
After the contraction empties the blood in the ventricles, they begin to relax, which is marked by the T wave.
General characteristics :
- The normal T wave is asymmetrical; the first half has a more gradual slope than the second half.
Examples of abnormal T wave
| Abnormal Patterns | Possible Causes |
|---|---|
| Inverted |
|
| Tall peaked |
|
| Flat |
|
Components of ECG
Each ECG cycles consists of 5 waves: P, Q, R, S, T corresponding to different phases of the heart activities. The P wave represents the normal atrium (upper heart chambers) depolarization; the QRS complex (one single heart beat) corresponds to the depolarization of the right and left ventricles (lower heart chambers); the T wave represents the re-polarization (or recovery) of the ventricles. To interpret ECG, one needs to focus on the frequency (heart rate), regularity, shape and size of each individual waves and the timing and interaction between waves. The following diagram shows the components of a ECG cycle.
P Wave
The P wave occurs when both left and right atria are full of blood and the SA node fires. The signal causes both atria to contract and pump blood to the ventricles (lower chambers). Any abnormality is generally associated with the SA node and the atria.
Lead II and V1 are the best leads to observe p-waves.
General characteristics :
- Less than 100ms in duration
- Less than 2.5mm in amplitude
Examples of abnormal P waves
| Abnormal Patterns | Possible Causes |
|---|---|
| Inverted |
|
| Greaten than 2.5mm in amplitude |
|
| Longer than 100ms with two lobes |
|
| Invisible or absent |
|
PQ Segment
When the signal from the SA node arrives the AV node, the signal is slowed and paused for a short period to allow blood from the atria to fill the ventricles.
General characteristics :
- 120 - 200ms in duration from the beginning of P wave to the beginning of QRS complex (PR interval)
Examples of abnormal PR interval
| Abnormal Patterns | Possible Causes |
|---|---|
| Greater than 200ms in duration |
|
| Less than 120ms in duration |
|
Q Wave
The Q wave is generated when the AV nodes releases the signal that travels through the inter-ventricular septum.
General characteristics :
- Less than 2mm or 3ms in duration
- Less than 25% of the corresponding R wave amplitude
- Normal Q wave in lead III may diminish or disappear on deep inhaling because of the change in the heart relative position; however the infarction related Q wave persists.
R Wave
R wave is the first positive deflection after the P wave regardless whether a Q wave exists or not. As the signal continues from the AV node and spreads to the ventricles, the signal triggers a contraction on the left ventricle that pumps blood out of the ventricle.
There may be multiple R waves.
S wave
S wave is generated when the basal parts of the ventricles are depolarized resulting in the contraction of the right ventricle.
QRS Complex
The Q, R and S waves together are referred to as QRS complex (even if some of its components are missing). It is the electrical forces generated by ventricular depolarization and represents the pumping action of the ventricles.
General characteristics :- 80 - 120ms in duration
| Abnormal Patterns | Possible Causes |
|---|---|
| Greater than 120ms in duration |
|
| Less than 120ms in duration |
|
ST Segment
The ST segment marks the time for the ventricles to pump the blood to the lung and body. In normal situations, it serves as the base line from which to measure the amplitudes of the other waveforms.
Examples of abnormal ST segment
| Abnormal Patterns | Possible Causes |
|---|---|
| Depressions |
|
| Elevations |
|
T Wave
After the contraction empties the blood in the ventricles, they begin to relax, which is marked by the T wave.
General characteristics :
- The normal T wave is asymmetrical; the first half has a more gradual slope than the second half.
Examples of abnormal T wave
| Abnormal Patterns | Possible Causes |
|---|---|
| Inverted |
|
| Tall peaked |
|
| Flat |
|
Shipping Information
Shipping Weight: 0.00 Pounds
Availability: In stock! Ready to ship.
Shipping Cost: US Shipping included! Int'l Shipping calculated at checkout
In-stock items are normally shipped within 24-48 hours on business days. For special handling or overnight shipping, please call us at 281-664-1209.
Manufacturer Information
Manufacturer:
Item Code:
Product belongs to these categories...
Home ECG / EKG Monitor
